
Foreword
General
The Environment Editor is a tool for creating and editing the SOTO working environment.
About this document
These operating instructions describe the functions of the Environment Editor. It is intended to support people who are trained in the use of the Environment Editor in their work.
The operating instructions must not be used by a person who has not been trained in the use of the Environment Editor.
Safety
Intended use
The following is considered as intended:
-
Use by personnel trained in the use of the Environment Editor.
-
The creation and editing of areas in which SOTO may be used as intended.
The following are not considered as intended:
-
Use by personnel untrained in the use of the Environment Editor.
-
The creation and editing of areas in which SOTO may not be used as intended.
Floor condition
The SOTO working environment must have the following properties
-
Free from obstructions and impurities.
-
Complies with the necessary VDMA guidelines.
-
Has sufficient load-bearing capacity for the operation of SOTO.
-
Level, horizontal, and uniform according to DIN 18202 and DIN 15185.
-
Mechanically resistant to abrasion.
-
Mechanically resistant to deformation.
-
Stairs, pits, ramps or similar must be mechanically secured against SOTO falling.
Personnel
Trained personnel are people who have been instructed by Magazino in the use of the Environment Editor.
Overview
Pictograms used
Toolbar

|
The selection tool can be used to select and move individual objects on the map. If you move the mouse cursor over this tool, you can choose from a range of selection tools, including: isolated docking nodes, nodes and edges. Shortcut: “S” (Press multiple times to switch between different selection tools) |

|
The work area marks the area on the map where SOTO is allowed to move. |

|
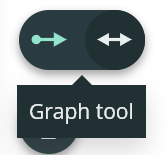
The graph tool can be used to draw travel paths for SOTO. If you move the mouse cursor over this tool, you can switch between one-way and two-way paths. Shortcut: “G” (Press multiple times to switch between graph tools) |

|
The handover stations are drawn on the map to show SOTO where the handover stations are located in the real working environment.
|

|
Obstacles are drawn on the map to set up areas where SOTO is not allowed to drive. Shortcut: “O” |

|
The chargers have to be placed on the map to show SOTO where the charging stations are located in the real working environment.
Shortcut: “C” |

|
The parking zones are drawn on the map to show the robot where it is permitted to stand when there are no tasks. |

|
Elevators allow the robots to navigate between different floors. |

|
Speed areas are configurable areas where specific driving speeds can be prescribed. Shortcut: “Z” |

|
Exclusive areas are configurable areas where only one robot can operate at a time. |

|
The SOTO Guide serves as a tool for test-driving areas with a scaled SOTO model.
|

|
The measuring tool can be used to determine the distance between objects. Click on two different points on the map to measure the distance (shown in label). Deactivate it by switching to another tool. Shortcut: “M” |
Header

|
Click on the Magazino logo to return to the Magazino Fleet Manager. |

|
The Undo button deletes the last steps in reverse order. Shortcut: “Ctrl+Z” |

|
Restore brings back work steps that were deleted using the Undo button. Shortcut: “Ctrl+Shift+Z” |
|
In the center of the header bar you see the name of the environment and the current version. You can change the version by selecting from the dropdown list. The version will open in a separate tab. If applicable, a white dot is shown to indicate that there are unsaved changes in the environment. If the current version is activated, it is marked with the word “Activated” next to the dropdown icon. |

|
The “help” button can be used to view keyboard shortcuts, language settings, licences, documentation and to contact Support. |

|
The validation shows every critical aspect about the environment that needs to be fixed before the environment can be activated. The validation tool can currently be used to:
|

|
The activation button activates the environment. Activating an environment is not possible if:
|

|
Pressing “Save” will save a new version of the current environment. The new version will be included in the environment library. The environment can be activated in the environment library if it does not contain any validation issues. |
Bottom line
|
Bottom left 
|
From left to right:
|
|
Bottom right 
|
From left to right:
|
Content panel
All objects used in the environment are displayed in the left-hand panel. The object groups can be expanded by clicking on the arrow icon. You can locate an object on the map by clicking on an object in the group.
The buttons at the bottom of the panel can be used to duplicate, unhide and unlock several objects at once.
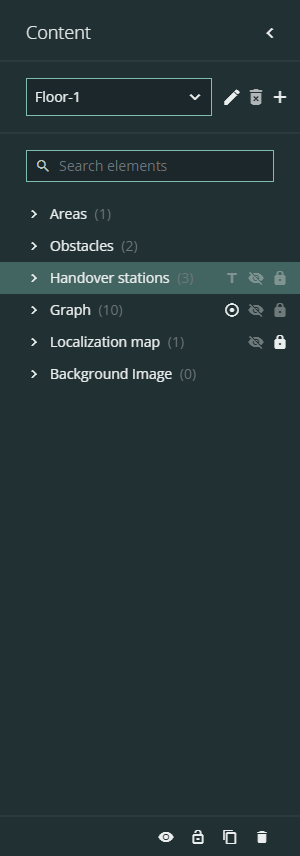
Functionality in the content panel:

|
Hide and show single objects on the map. |

|
Lock and unlock selected objects. Locked elements cannot be moved, rotated, or changed. |

|
The “T” button can be used to show and hide the names of the handover stations. |

|
Hide/Show Fence (located next to “graph”): This button toggles the visibility of the graph's fence. The fence defines the maximum space available to SOTO for navigation and can be edited in the properties panel of each edge and node. |

|
Shows the node names on the map (located next to “nodes”). |

|
The eye can be used to turn the visibility of the selected layers off and on again (located in the footer of panel). |

|
Unlock all locked objects (located in the footer of panel). |

|
Duplicates the selected object (located in the footer of panel). Duplicated objects have a consecutive number, such as _01, _02, _03, as an ending in the name. |

|
The trashcan can be used to delete the selected objects (located in the footer of panel). |
Commissioning
Create a new environment
-
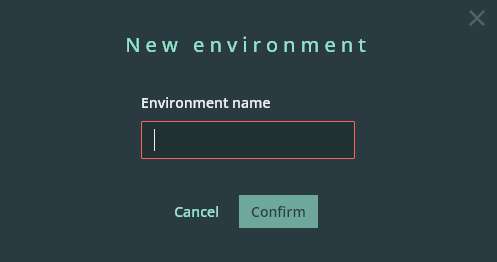
Select “New environment” in the environments tab.
-
Name the environment and click “Confirm”.
-
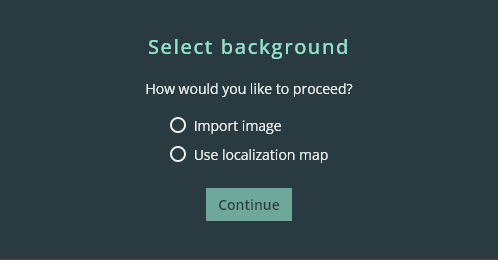
Select the background. Start with an image or a localization map. Click “Continue”.
Note: You can still change the image or select a different localization map in the created environment at a later point.
-
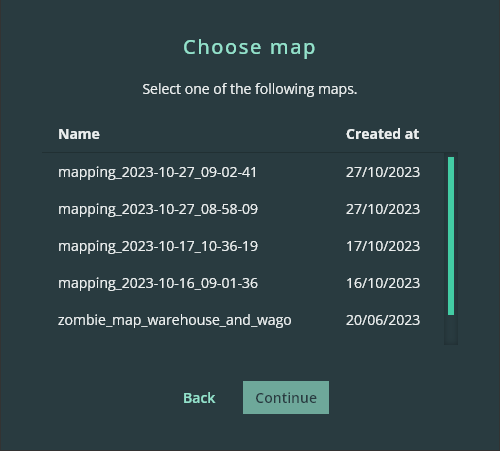
Choose the map from your library.
-
Alternatively, use an image from your computer. Click “Open”.
-
Max file size: 15mb
-
File types: PNG or JPG
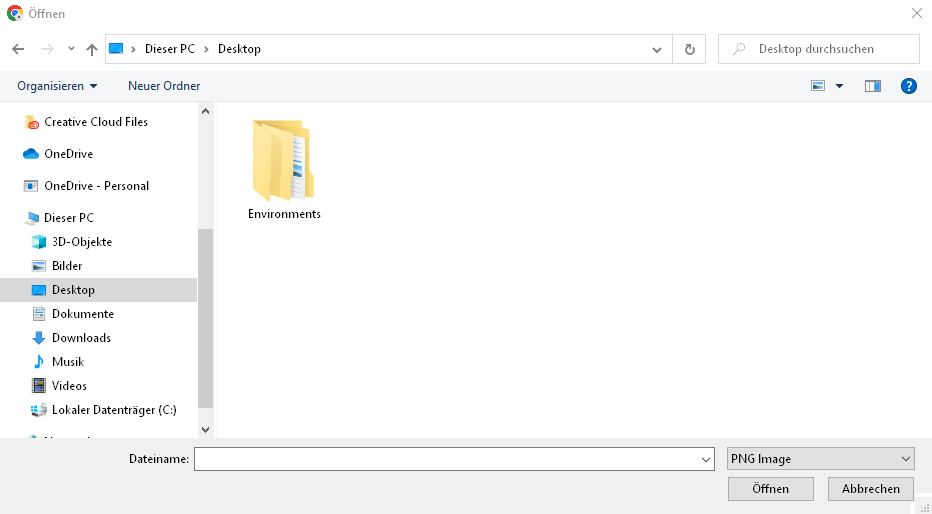
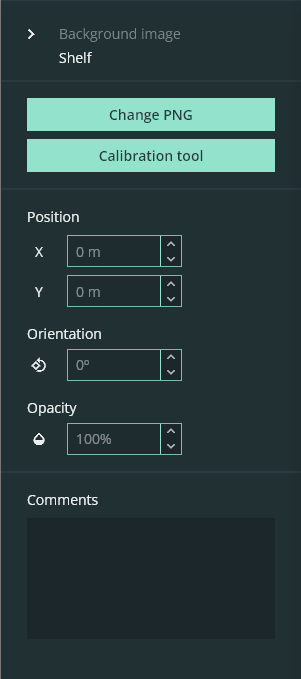
a. After selecting an image, the editor opens. You need to calibrate the image by clicking on the “calibration tool” button on the right-hand side.
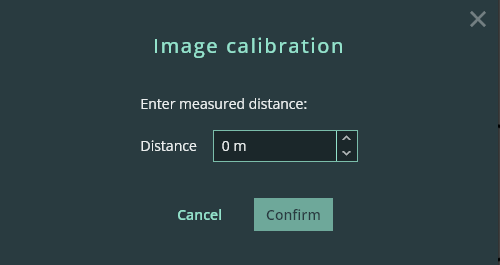
b. To define a distance, click on the start and end points of the desired segment, then enter the distance value in the pop-up window.
c. Afterward, the image will recalibrate and be displayed in the respective dimensions.
You can add or change a map/image by clicking on it in the left-hand content panel. Then, edit the map or image in the properties panel on the right.
Preparation
To place objects accurately, the localization map should be aligned horizontally before starting the modeling.
-
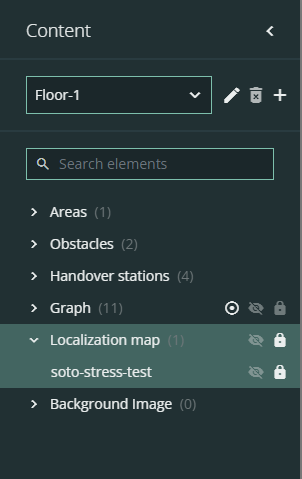
In the content panel, select Localization map.
-
Unlock the laser scan by clicking the “Unlock” icon.
-
Change the orientation in the right-hand menu via the "Orientation" field, or click on one of the corners of the map until the laser scan is aligned.
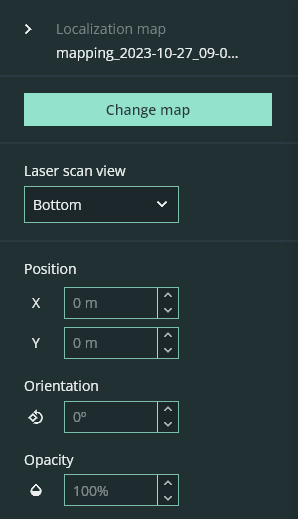
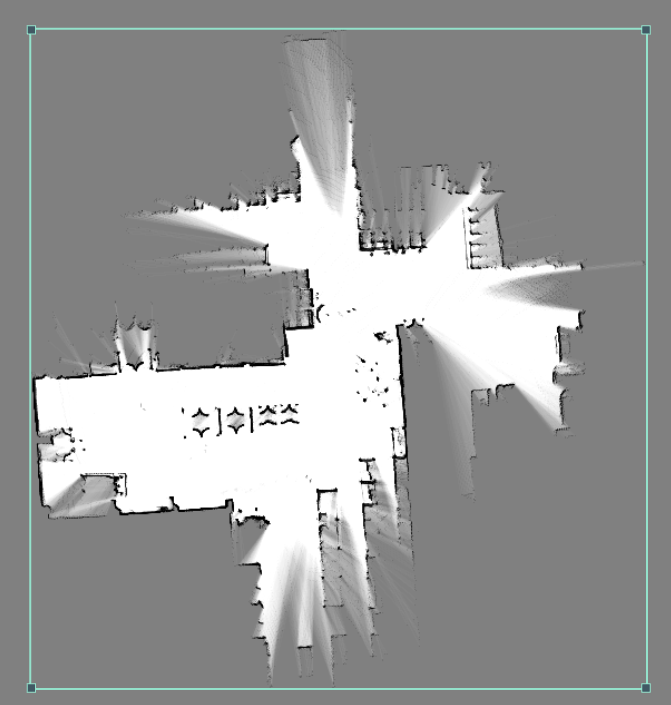
This step should take place at the beginning. Reorienting the laser scan later will not include the objects already placed on the map.
Operation
Create a work area
The work area marks the area on the map where SOTO is allowed to move.
-
In the “Environment” tab, select “Work Area”.
The mouse pointer changes to the work area mode. -
Select a location on the map to place the first node of the work area.
-
Select another location on the map to place the second node of the work area.
A line connects the nodes.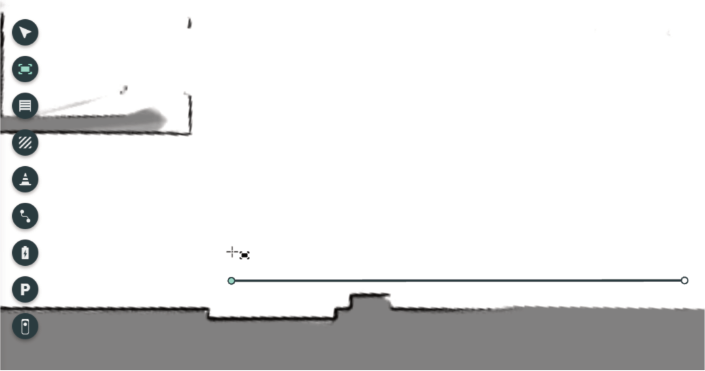
-
Select another location on the map to place the third node on the map. The area between the nodes is filled. The filled area represents the work area of SOTO.
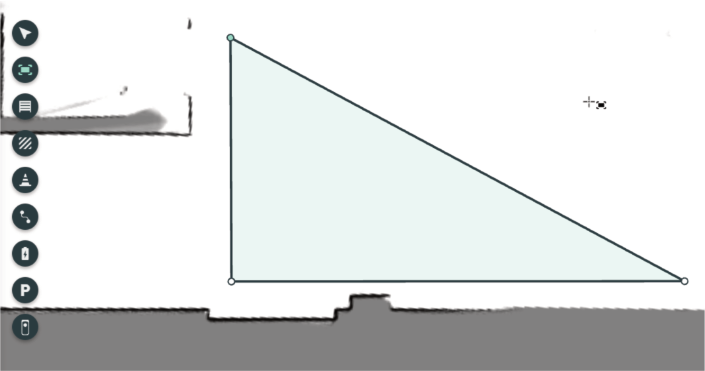
-
Click on the map as many times as needed to fully define the work area.
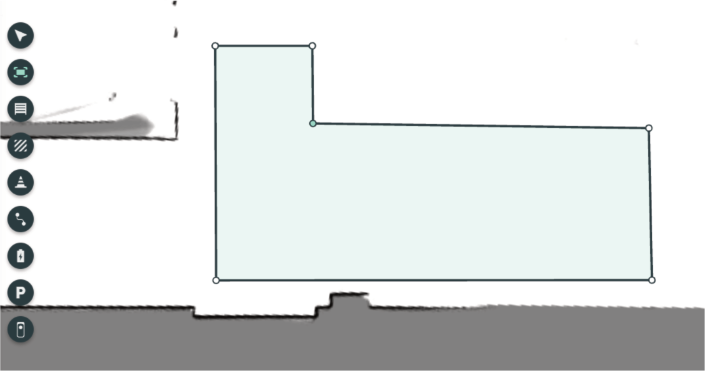
The work area can be of any size and consist of any number of nodes.
Use the mouse pointer to select a node point. Selected node points can be moved or deleted using the Backspace key.
Use the mouse pointer to select the connection between two node points in order to add another node point to the line.
Press and hold the "shift" button while modeling to easily draw straight and diagonal edges.
Block map areas for SOTO
-
In the “Environment” tab, select “Obstacles”. The mouse pointer changes to obstacle mode.
-
Select a location on the map to place the first node of the area to be blocked.
-
Select another location on the map to place the second node of the area to be blocked.
A line will connect the two nodes.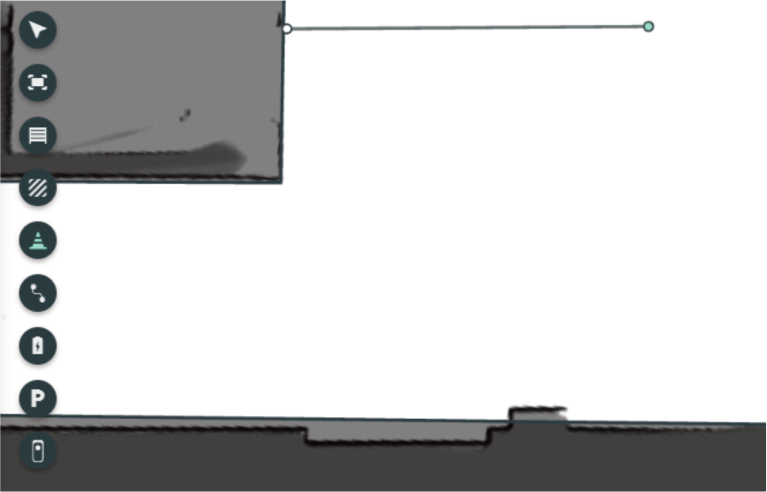
-
Select another location on the map to mark the third node of the area to be blocked. The space enclosed by all nodes will be filled in, representing the blocked area on the map.
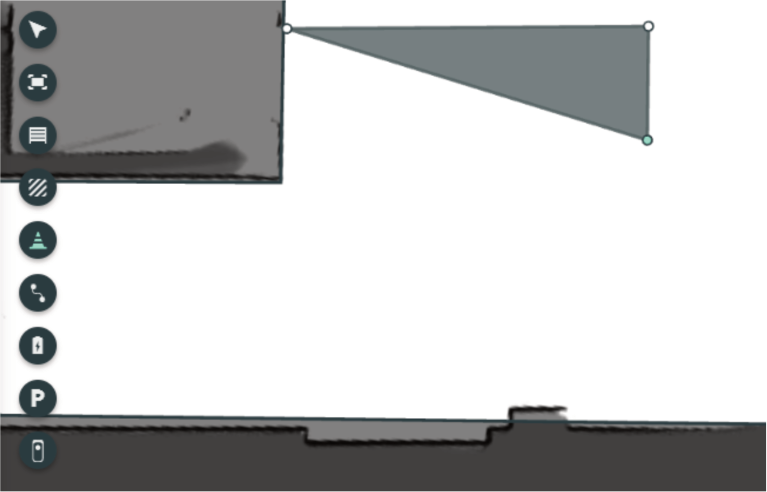
-
Click on the map as many times as needed to fully define the blocked area.
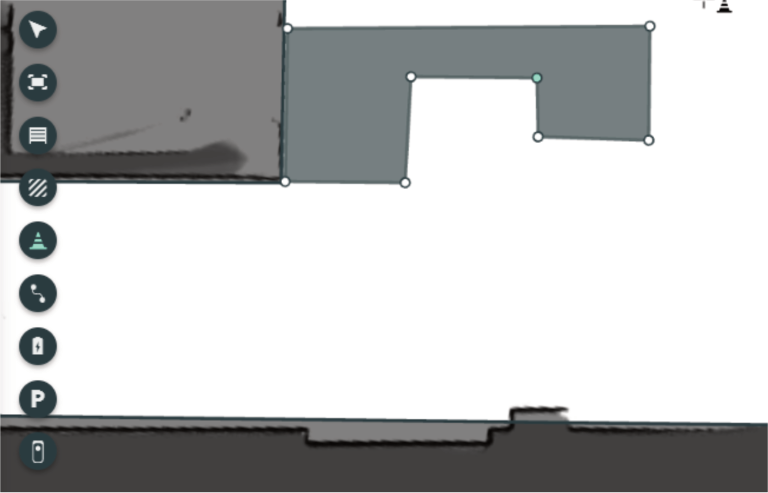
Blocked areas can be of any size and can consist of any number of nodes.
Use the mouse pointer to select a node. Selected nodes can be moved or deleted using the Backspace key.
To add another node, select the connection between two existing nodes with the mouse pointer.
Press and hold the "shift" key while modeling to draw straight and diagonal edges more easily.
Measure handover stations
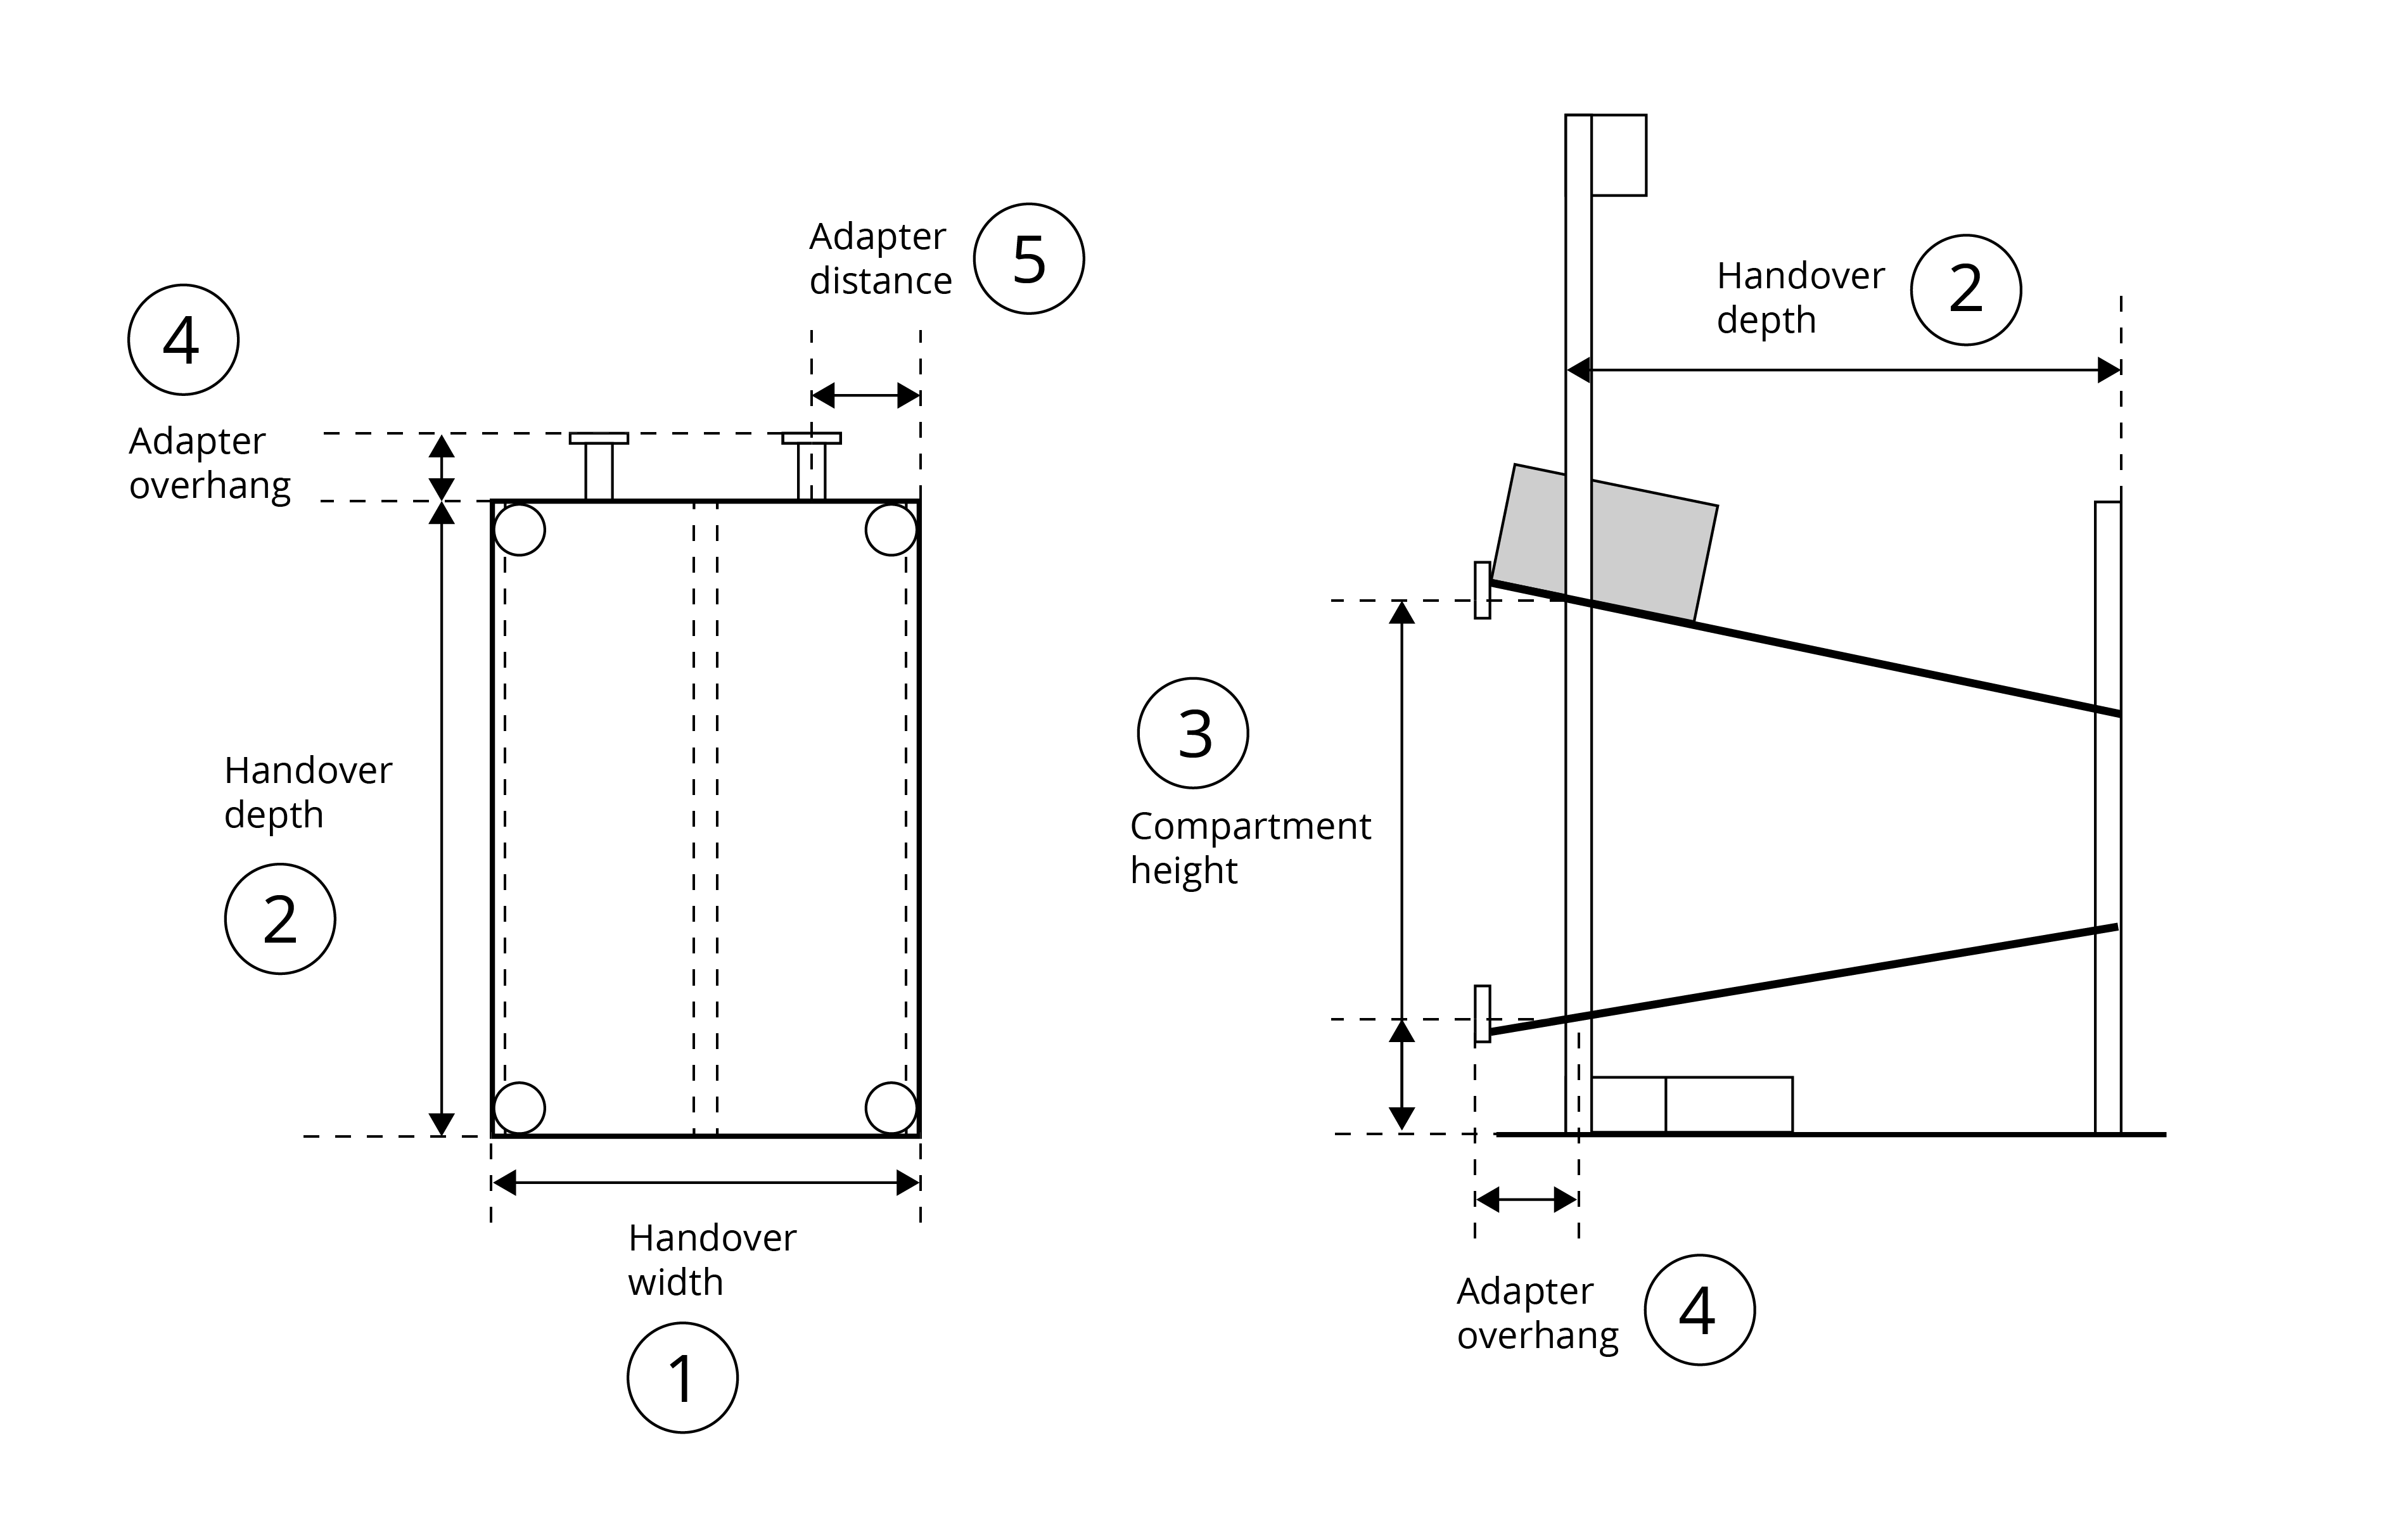
|
|
Create handover stations
-
Click the "Handover station" button.
-
Create the handover station:
-
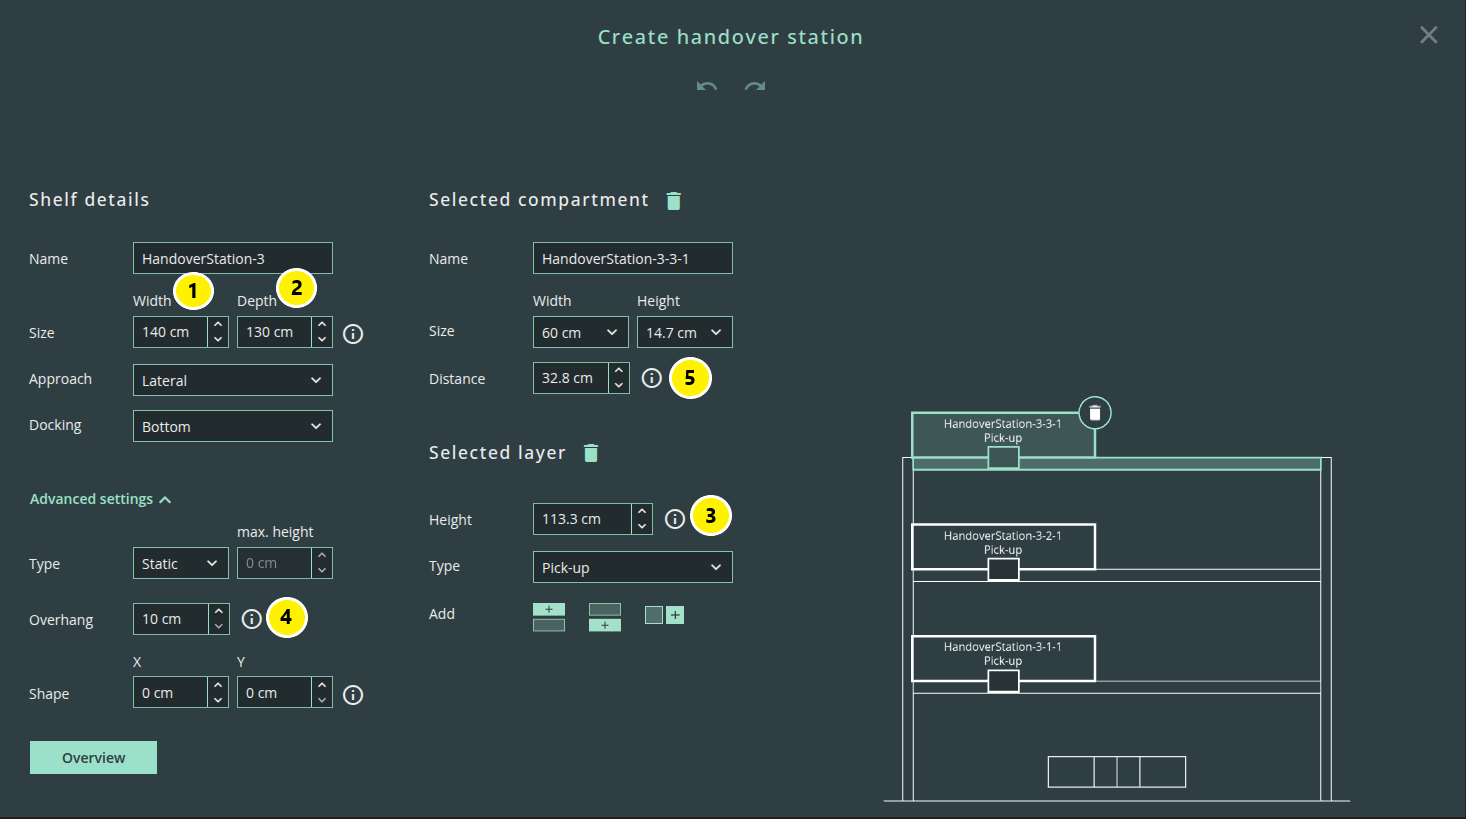
General shelf details
-
Name: free text
-
Total size: width (min. 20 cm/ max. 250 cm), depth (min. 20 cm/ max. 350 cm)
-
(Docking-) Approach: frontal, lateral
-
Docking (shape position): top left, Top right, bottom
-
Advanced settings:
-
Type: static, adjustable
-
Adapter overhang (adapter distance to the front): default, 10 cm
-
Shape offset: x, y (
values differs between the shapes)
-
-
-
Selected compartments
-
Select individual compartments in the graphic and enter the dimensions for each one separately.
-
You can select multiple compartments by holding down “Ctrl.” This allows you to adjust the size and layer type of all selected compartments simultaneously. Other input fields will be disabled while multiple compartments are selected.
-
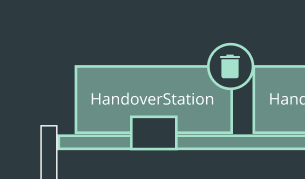
To delete compartments, press the icon next to the headline or the bin icon next to the diagram.
-
Compartment settings
-
Name: free text
-
Size: width (20, 30, 40, 60 cm), height (8, 12, 14.7, 22, 28, 32 cm)
-
Adapter distance: distance from the left shelf edge to the center of the compartment in cm.
-
-
-
Selected layers
-
“Selected layer” corresponds to the currently selected compartment. When multiple compartments are selected, layer input is restricted, and only the “Type” field remains available.
-
Layers can be deleted via the bin icon next to the headline.
-
Layer settings:
-
Height: Height from the floor to the top edge of the shelf layer.
-
Type: pick-up, put-down, conveyor (includes pick-up and put-down). The chosen type applies to all compartments of the selected layer.
-
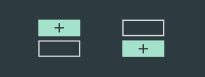
Add (layers): Click the plus buttons to add layers above or below the selected layer.
-
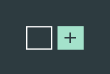
Add (compartment): Click the plus button to add a compartment to the right of the selected compartment.
-
-
-
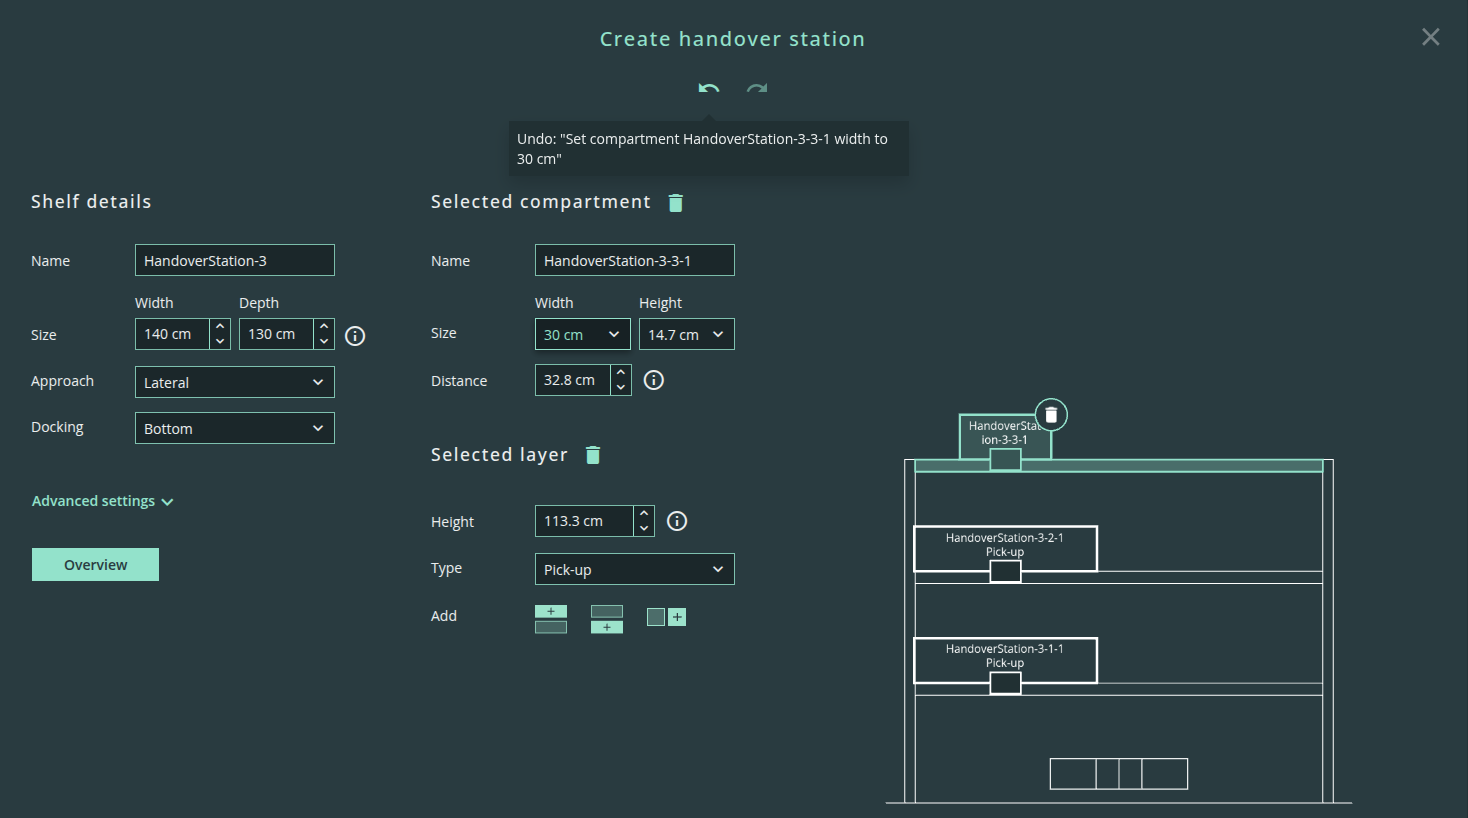
You can undo and redo all actions by pressing the arrows underneath the page header. Each action is described in the tooltip.
Modelling issues:
Critical issues (marked in red): Handover station cannot be created
Warnings (marked in yellow): Configuration can lead to problems during operation
-
You can view all compartment and shelf details at once by pressing the “Overview” button.
-
When you are done modeling the handover station, press “Create”.
-
The handover station will appear on the map and can be moved to the desired position by clicking and dragging. The properties panel on the right provides an overview of the exact handover details.
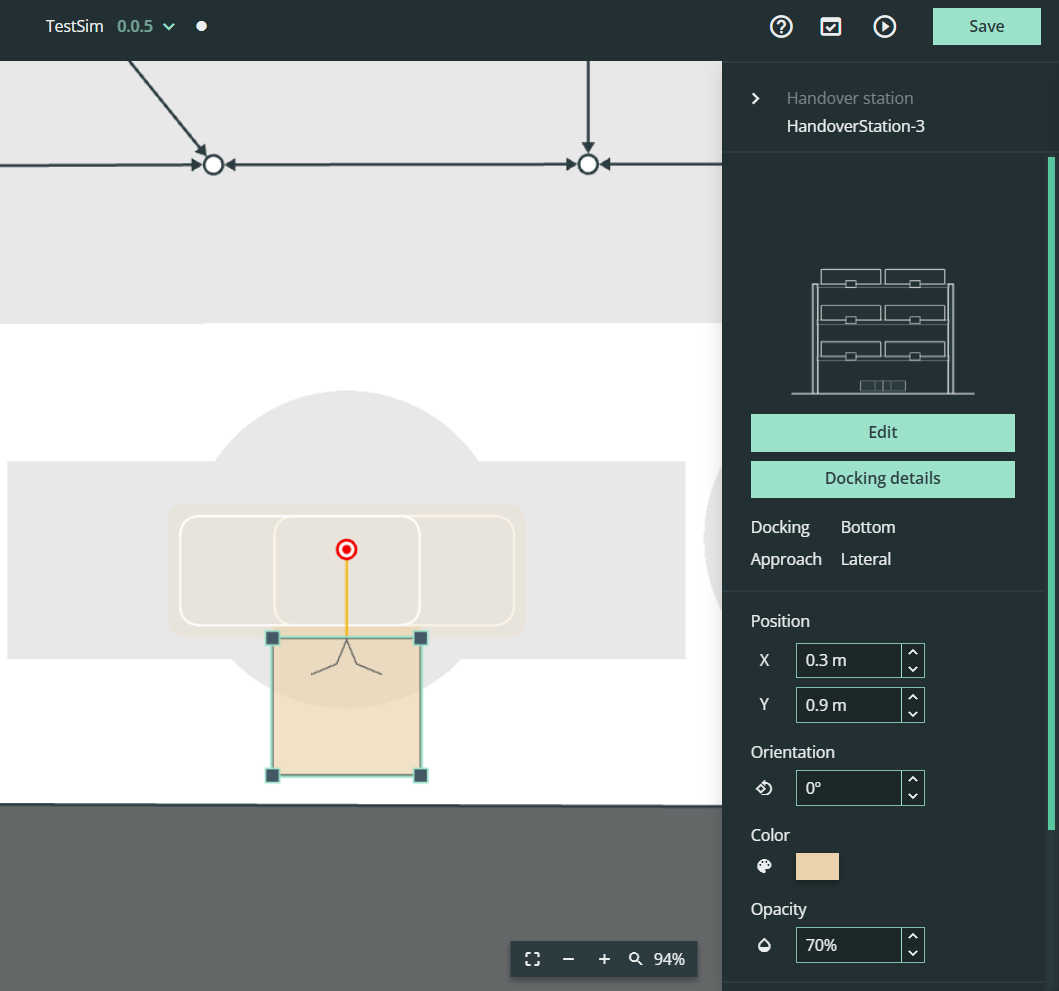
How to place handover stations
The position of the physical handover station must not differ by more than 20 cm from the virtual position on the map.
Once the shelf is modeled, it needs to be placed on the map. This step is critical, as it informs the robot where to expect a handover station in the environment.
Due to the robot's large size, it requires adequate space to dock to the handover station. The main challenge in placing handover stations is maintaining proper alignment relative to other handover stations, the environment, and nearby obstacles. If the stations are not correctly aligned, the robot may dock at an angle (if docking is possible), which can reduce performance and increase operation time.
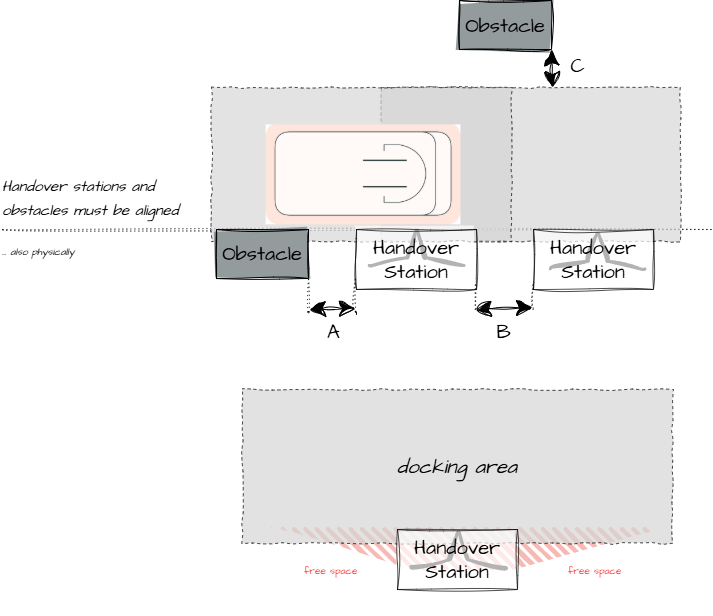
The figure above summarizes the key values to consider when placing handover stations:
-
When placing multiple handover stations in a row or near obstacles, it is critical to ensure they are properly aligned in both the virtual model and the physical environment.
-
Minimum free space requirements (for shelves with a pillar diameter of
5 cmor less):-
Stations with a total length between
0.5 mand1.15 mrequire20 cmof free space (A and B). -
Stations with a total length between
1.5 mand1.4 mrequire32 cmof free space (A and B). -
Stations with a total length above
1.4 mdo not require any free space.
-
-
The docking area must be kept clear of obstacles.
-
The handover stations can be placed with a positioning tolerance of up to
20 cm.
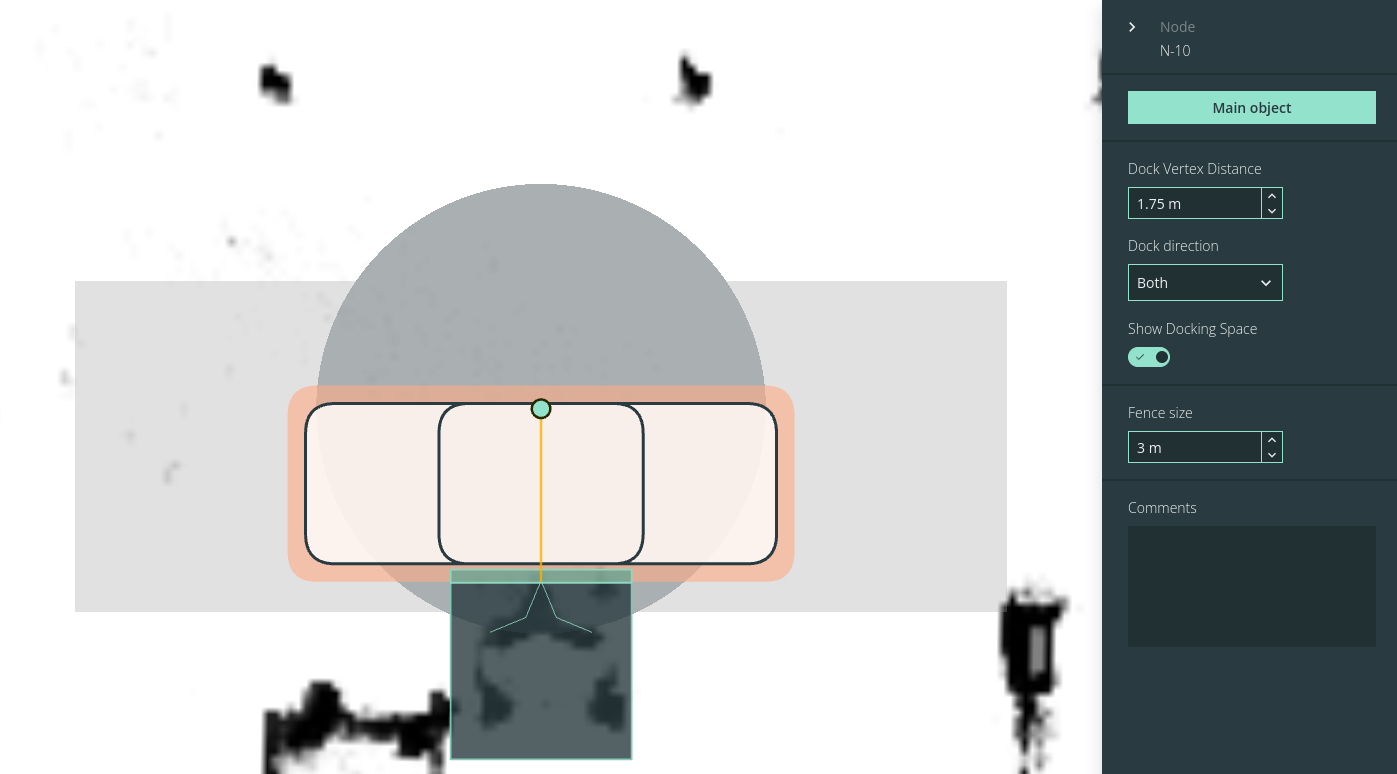
Tips
-
The more accurate the placing, the better the performance of the robot. By placing the virtual handover stations at the exact location of the physical ones, you can improve and speed up their detection.
-
If the docking area overlaps with obstacles on one side, you can restrict the robot's docking direction. This forces the robot to dock from the unobstructed side, allowing you to place a handover station next to obstacles.
-
If you want to create multiple identical handover stations, you can duplicate them in the left-hand content panel or by using Ctrl+C / Ctrl+V.
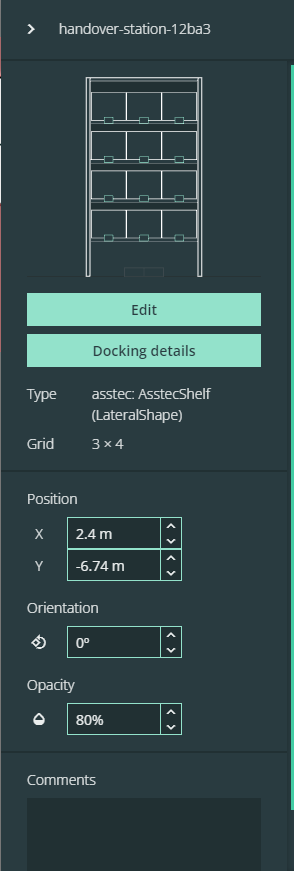
Properties of the handover station
-
Name of the handover station (click on the name to edit)
-
Change the layout by clicking on “Edit”
-
Change the docking details by clicking on “Docking details” see Creating the Graph
-
Position the handover station by entering numeric values into the input fields or drag and drop
-
Define the Orientation by entering numeric values into the input fields or drag and drop
-
Edit the Opacity to more easily view the background image (map).
Steps after placing the handover station
-
Position the handover station correctly according to laser-scan on the map.
-
If it has been moved since the last mapping, align it by measuring its position in the physical environment and then verify the alignment using the Measurement Tool (shortcut “M”).
-
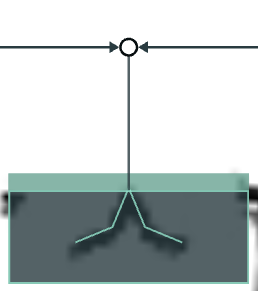
-
If you are placing it next to a row of existing shelves, select multiple shelves while holding “Ctrl,” and use the alignment tool in the right-hand properties panel to align their front edges.
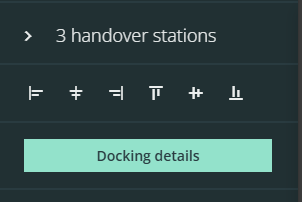
-
You can define further docking details in the properties panel by clicking on the handover station.
-
Toggle the “Show Docking Space” button to display the area that must remain clear for the robot to dock successfully.
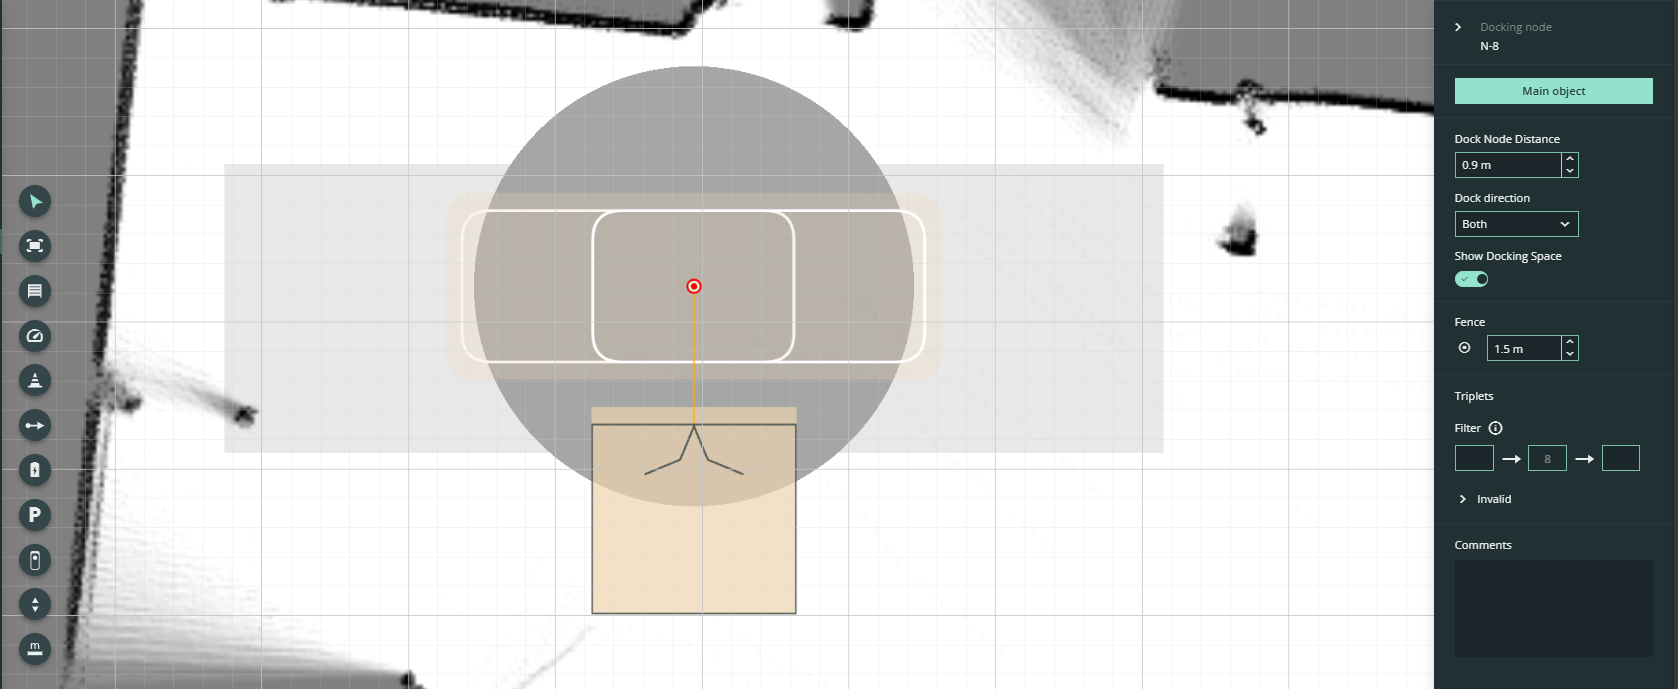
b. You can define the docking direction of the robot (frontal or lateral)
The docking space in front of the handover station changes according to the docking direction. In some cases, there may not be enough room to dock from a specific side, or docking from one side may be more efficient than the other.
c. If required, you can change the docking node distance. This defines the location the robot approaches before starting the docking process.
If possible, set the docking node distance to the maximum value. Only reduce the distance if there is not enough space.
Create chargers
In the master controller, you can set the battery percentage the robot must reach before it is allowed to resume operation.
-
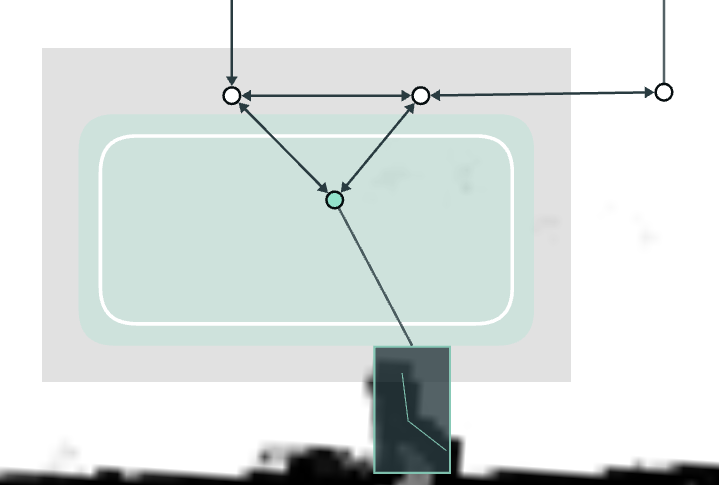
In the “Environment” tab, select “Charger”. The mouse pointer changes to the charger mode.
-
Place the charger on the map to match the physical location of the actual charger.
-
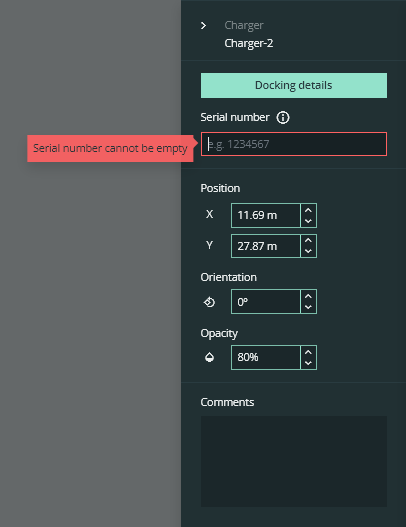
Click on the charger and enter the serial number in the “serial number” field.
You will find the serial number on a sticker on the charger
-
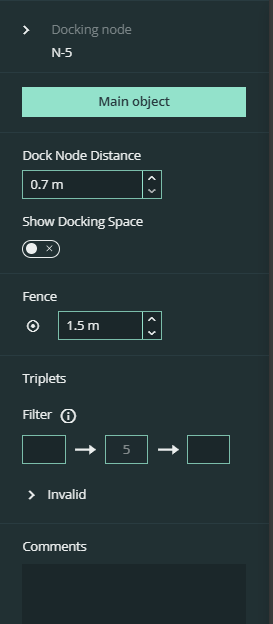
You can change the docking node distance via the “Docking details” button. This can also be done by clicking and dragging the node on the map.
-
The fence size can also be adjusted in the “Docking details” section.
Create a graph
Terminology
Graph
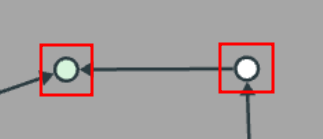
The graph represents SOTO’s driving path. It consists of nodes that are connected by edges. Nodes are placed on a map using the Graphing tool, thereby forming coordinates that guide the robot’s navigation.
Edges
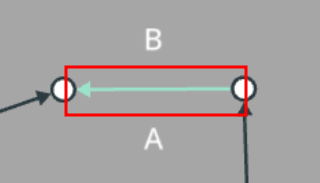
Edges are connections between nodes.
Example: Two nodes can be linked by an edge if there is sufficient space in the environment for the robot to navigate between them.
Nodes
Nodes are coordinates on a graph. They can be a coordinate purely used for navigating, or they can be connected to an object (e.g. a handover station, charger, elevator, etc.).
Example: The robot’s current location can be represented as one node, and its destination as another.
Docking nodes
A docking node is a designated approach point for the robot to access an object such as a handover station, charger, elevator, or parking spot. Ensure that there is sufficient space (e.g., clearance around a fence) for the robot to dock properly.
Object node (OBJ)
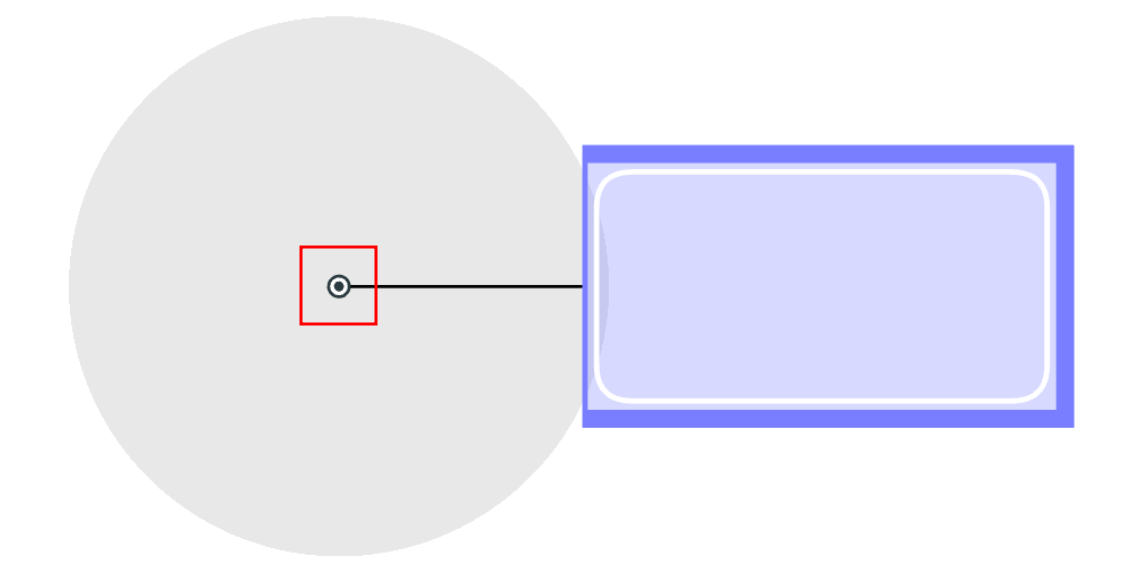
Object nodes are special nodes that are not displayed on the graph. They represent the precise location the robot must reach to interact with an object. This means the robot needs to drive a little further than the docking node to actually reach the object.
The Graph tool makes it possible to define the routes of the robot fleet, and to impose traffic rules to avoid accidents:
-
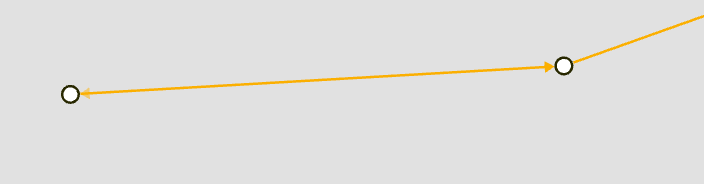
In the “Environment” tab, select the “Graph tool”. You can choose between one and two-directional edges. The mouse pointer changes to graph mode with the selected direction.
To convert a bi-directional edge to a one-directional edge, click the arrowhead. To convert it back into a bi-directional edge, click the end of an edge without an arrow (near the node).
To create a node, left-click anywhere on the map.
-
You can add successive nodes by left-clicking on points of the map. Changing the position of the nodes is always possible, as long as they are not locked.
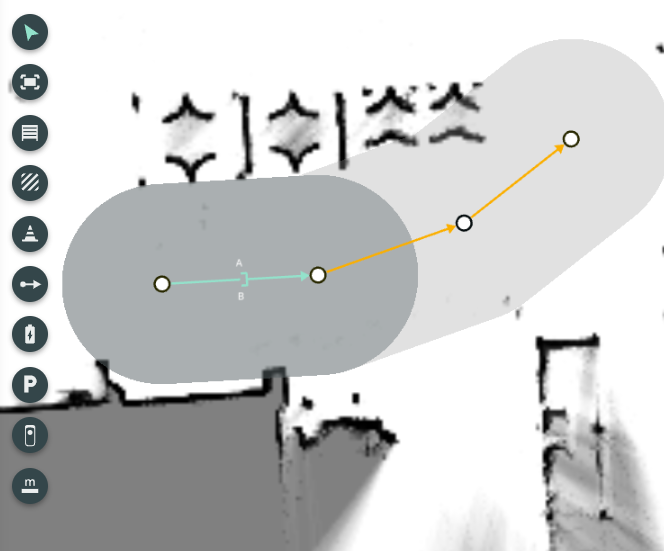
-
The right-hand panel lets you set the fence width, robot orientation, and driving direction for the next node you place on the map. These settings will remain in effect until you change them.
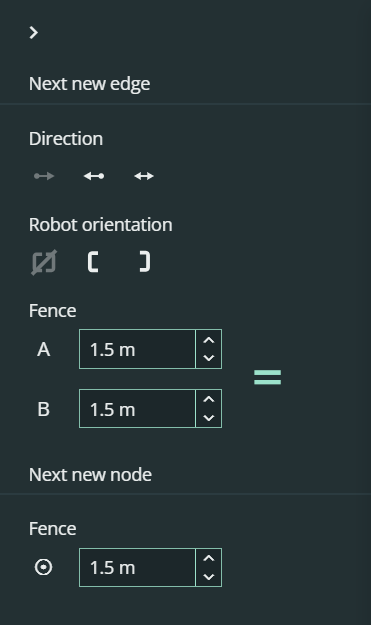
-
The fence setting defines the allowed driving width for the robot along a given edge and node. To adjust the fence size, use the input fields in the right-hand panel. On the map, the fence appears as a gray area surrounding the edges.
To create an asymmetric fence, click the "Equals" sign. "A" and "B" represent the left and right sides of the fence, respectively.
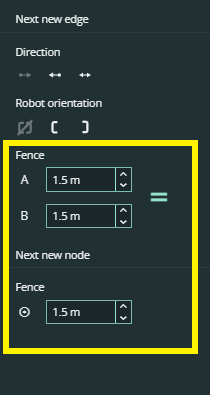
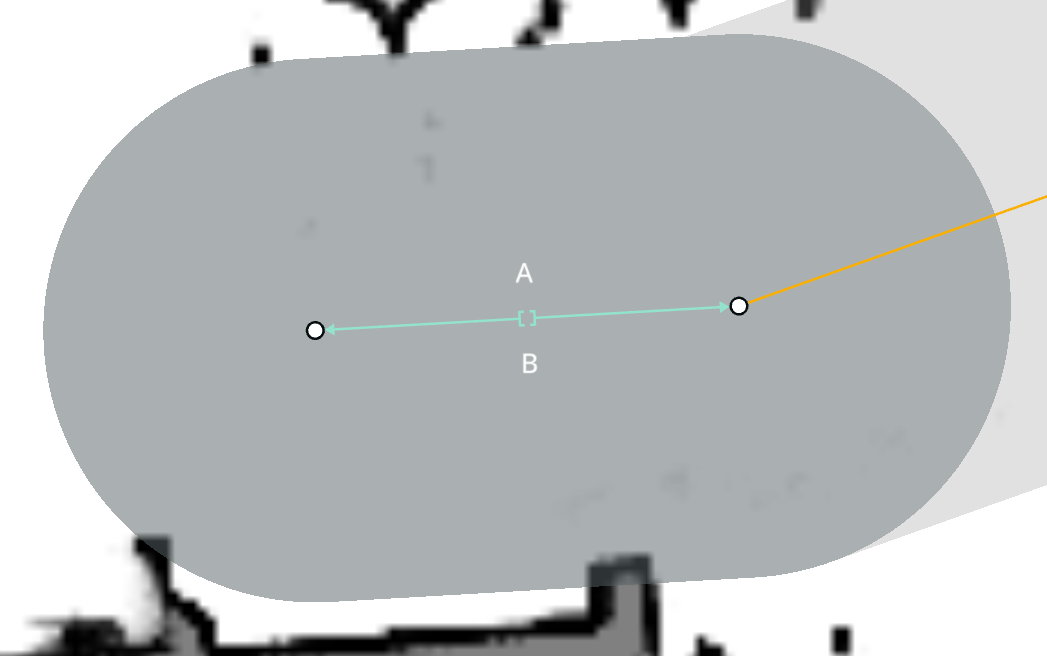
-
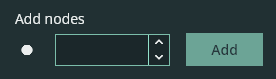
You can also split an edge into multiple nodes by clicking on the edge and defining the number of nodes in the right-hand panel. Then click “Add”.
-
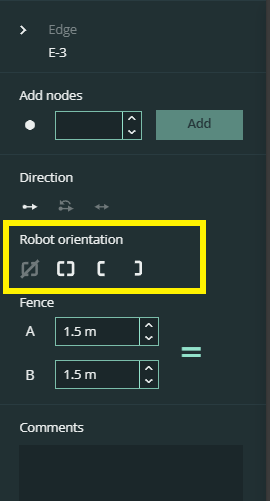
Besides the driving direction, you can also change the robot’s orientation in the properties panel. The default value of the edge is always frontal (non-open side of the bracket symbol). To change it, click the “Robot Orientation” icons. The orientation will be displayed on the map.
-
When you directly connect two handover stations, the edge is displayed as a switch side symbol (a square). Switch side edges allow the robot to move laterally between handover stations that are positioned opposite of each other.
The orientation of this edge depends on the docking orientation of the handover station where the robot will dock next.Note: The robot may become stuck if the docking orientations require it to make a 180° turn before docking.
.png?cb=1b919f09b47cb4eb9f3c9536a4c1c71e)
-
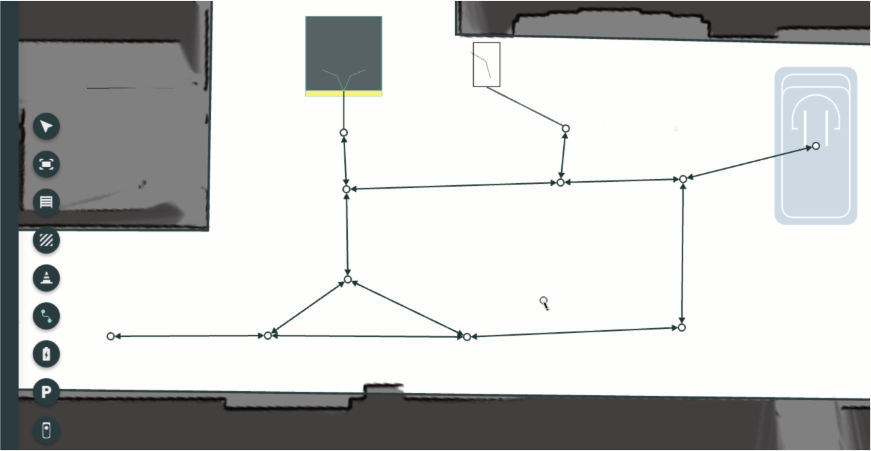
Finalize the graph by connecting the nodes of your handover stations, charging stations and parking area to the nodes of the graph. Once all objects are connected to the graph, SOTO can navigate between them.
-
You can receive feedback about the feasibility of the graph by using the validation tools (see “Validation” section of manual).
Specify speed limits
There may be areas in the work environment where you want to impose a maximum speed.
-
In the Content panel tab, select “Speed Area”. The mouse pointer changes to zone mode.
-
Click and hold the mouse button, then drag to create the speed zone on the selected map location.
-
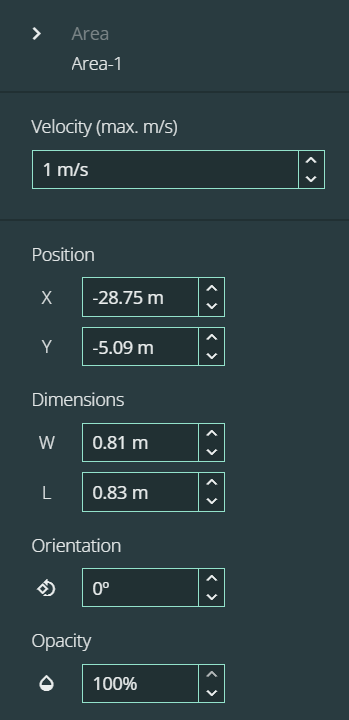
A panel opens on the right-hand side to edit the selected zone.
-
Enter the speed limit in the “Velocity” field.

|
Notice! |
|---|---|
|
0.3 m/s is the safe speed. It should be selected if there are safety concerns at specific locations in the work area. |
Create parking zones
You can mark areas on the map where SOTO is allowed to wait when there are no active jobs.
-
In the Content panel, select “Parking Zone”. The mouse pointer changes to the parking area mode.
-
Select the location in the work area where SOTO is allowed to temporarily park when no active job is assigned.
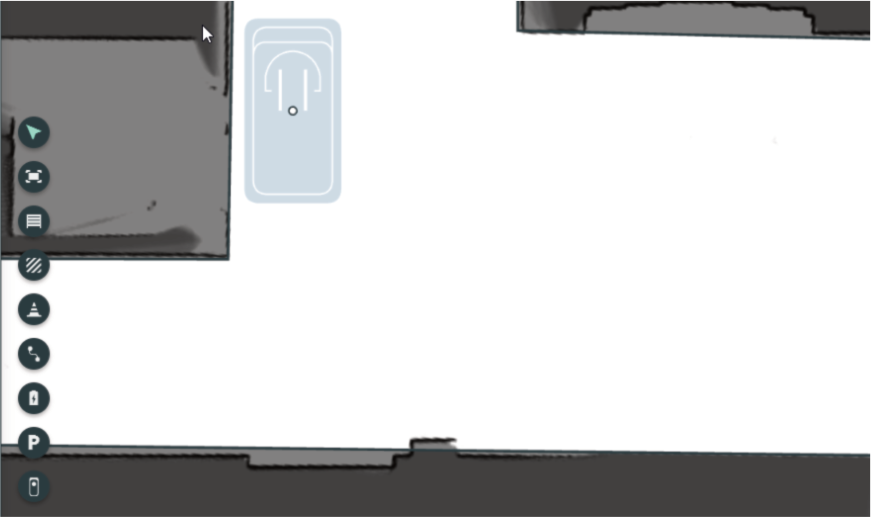
SOTO will navigate to this area when no active job is assigned and the battery does not need charging.
Add multiple parking areas if you have a larger fleet.
Create elevators
Use the elevator tool to define areas where SOTO is allowed to use an elevator to navigate between floors.
-
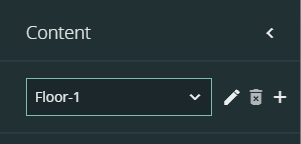
Add an additional floor to your layout by clicking the “+” icon in the content panel.
-
Select a background image or use an existing localization map as a basis for the new floor. The new floor is created afterwards.
-
You can rename or delete floors with the icons next to the dropdown.
-
You can now place the elevator on the map by clicking the “Elevator” icon in the left menu.

-
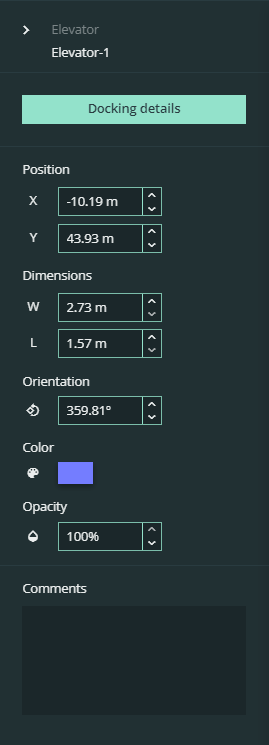
Click on the map to add the elevator. The properties panel on the right opens once the elevator is placed.
The walls of the elevator are represented by the thick blue lines on three sides, the thinner blue line represents the door. The docking node with its fence is located in front of the door.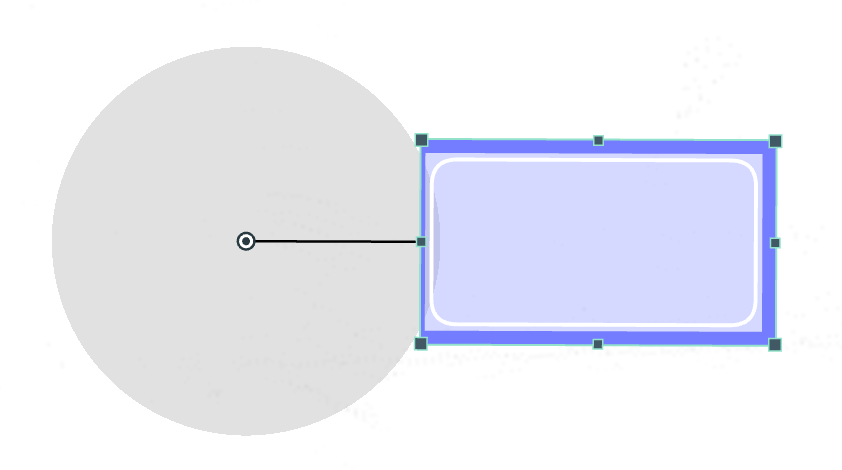
-
The size and position of the elevator can be changed in the right-hand panel or by clicking and dragging on the map. To delete the elevator press the Backspace or Delete key.
Note: If you delete an elevator, the connected elevators on other floors will be also deleted!
-
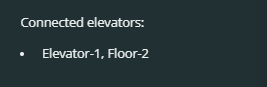
If a second floor was created, the elevator is automatically added and listed in “Connected elevators” on the right. You can click on this entry to easily switch between them.
-
For successful docking, make sure that the elevator’s docking node is connected to the navigation graph on all floors. Adequate space must also be available for docking. Note that only frontal docking is supported, with a minimum distance of 1.35 m and a maximum of 3 m.
Validation
The Validation tool can be used to check whether SOTO will encounter any potential issues while navigating in the working environment.
-
Click on the validation button in the upper right corner.
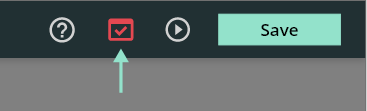
-
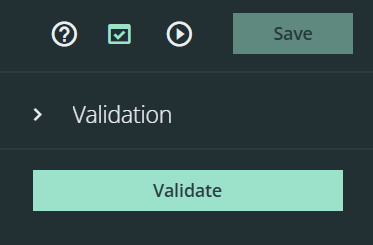
Press “Validate” in the panel to check the currently modelled environment.
Live validation is not available—please press the button after each environmental change.
-
Resolve all critical issues marked in red, as they prevent the activation of the environment. Warnings, shown in yellow, may cause problems but still allow activation. To inspect a problem, click the arrow next to its entry to view all linked objects. You can then click on any listed object to locate it on the map.
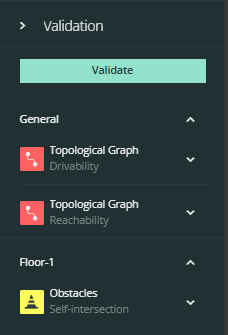
Critical issues (red) include: Connectivity issues (node prevents SOTO from navigating); Reachability issues (SOTO cannot navigate from one handover station to another); Drivability issues (all node triplets, which consist of three connected nodes, are invalid); no handover station; and no charger.Warnings (yellow): Drivability issues (some triplets are invalid); self intersecting obstacles; and no second elevator.
Special graph validation types
Transition validation
Where: Found in the "Drivability" dropdown in the validation panel.
What: The Transition validation assesses whether SOTO can navigate properly between three connected nodes. The validation considers factors such as orientation, direction, fence width, and the angles between edges. When changes are made to connected nodes or edges, the system checks the drivability of the affected transitions. The feedback indicates which transitions (i.e., sequences of three connected nodes) are drivable and which are not.
How it’s displayed: The validation panel shows a list with all invalid nodes.
Severity: Critical
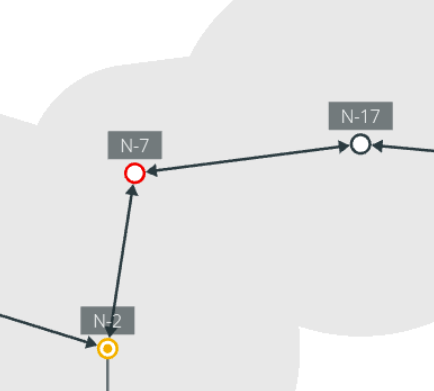
The node will automatically change its color to white if it is valid. However, to update the Validation panel, you must click the “Validate” button after the node’s color has changed.
How it looks in practice:
-
White nodes = all triplets have at least one valid transition
-
Yellow nodes = some triplets are invalid (i.e. have one or more invalid transitions)
-
Red nodes = all triplets are invalid (i.e. have only invalid transitions). Or, in the case of special docking nodes, all transitions of the same type (dock or undock) are invalid.
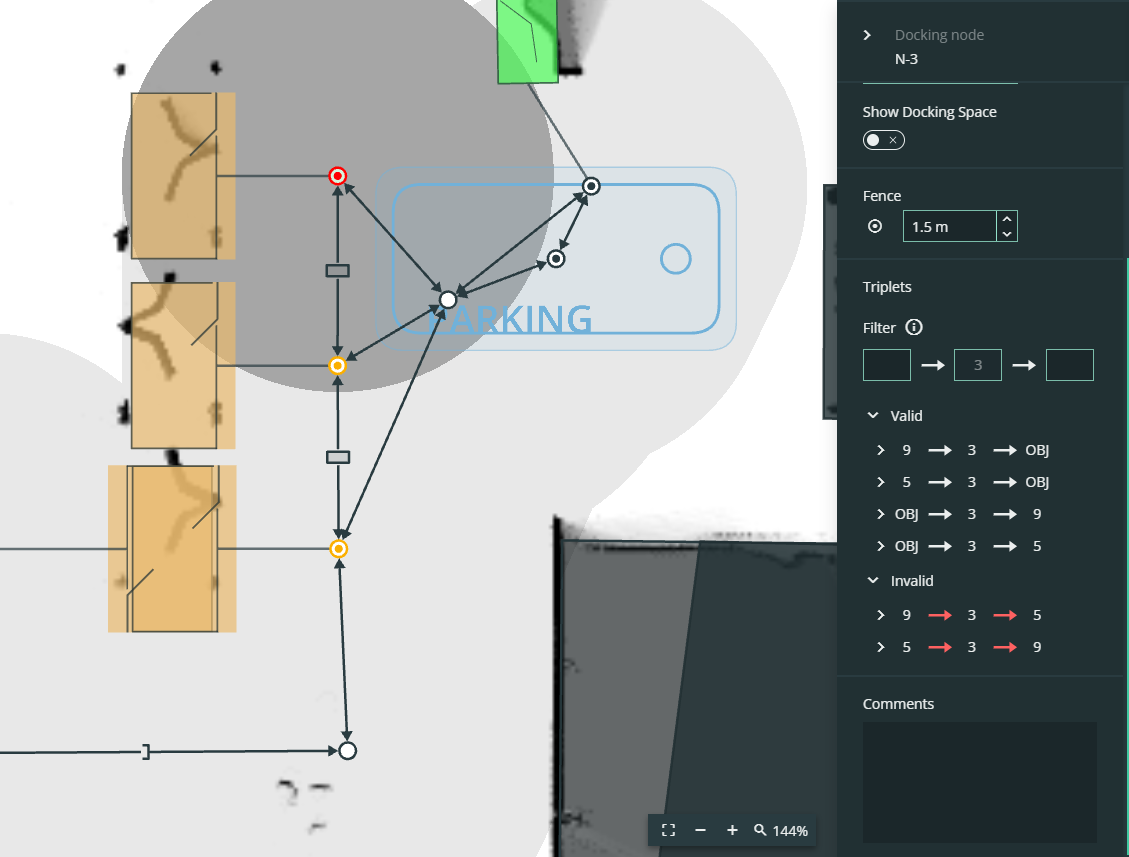
Docking nodes
Docking nodes are displayed both on the map and in the “Valid” and “Invalid” dropdowns of the right-hand panel. Arrows indicate the docking direction: frontal (square), lateral left, or lateral right. Docking orientation is also shown on the map.
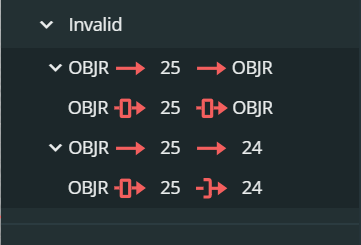
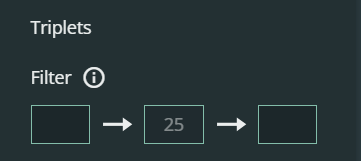
The transitions filter
The transitions filter can be used to search for specific transitions:
How to convert invalid into valid transitions
To resolve an invalid transition, consider adjusting the following:
-
The direction, orientation, or fence width of edges.
-
The angle between edges.
-
The fence width of the node.
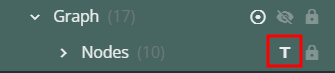
To identify the nodes more easily, make sure to activate the node names in the content panel:
Connectivity validation
Where: Found in the "Connectivity" dropdown in the validation panel.
What: The Connectivity validation assesses if all the nodes of a graph are fully connected. If certain nodes are not connected, the validation flags them.
How it's displayed: The validation panel shows a list with all disconnected nodes.
Severity: Critical
The node will automatically change its color to white if it is valid. However, to update the Validation panel, you must click the “Validate” button after the node’s color has changed.
If Connectivity errors are flagged, do not use the “Reachability” validation, since it cannot be calculated correctly.
.png?cb=704d1f1ca01d7f8444719d8792ead665)
Reachability validation
Where: Found in the "Reachability" dropdown in the validation panel.
What: Takes all dock nodes—chargers, handover stations, and elevators—and calculates if SOTO can reach any dock node Y starting from any other dock node X (and vice versa). If any dock node cannot be reached in either direction, it indicates a non-drivable path that may cause the robot to get stuck.
How it's displayed: The right-hand panel shows the top five broken links. Start investigating issues from the top of the list. Each node entry includes an example of a broken link, which can be used to trace the path and identify the underlying problem.
Severity: Critical
To view an update in the validation panel, you need to click the “Validate” button as soon as you have made any changes to the graph.
This validation is the most sophisticated and difficult to use. If there are any other validation errors, examine them first.
.png?cb=51c4928f494d54f0dfb60061b3df527a)
Save environment to SOTO
-
Save your environment.

-
Enter the name of the new version.
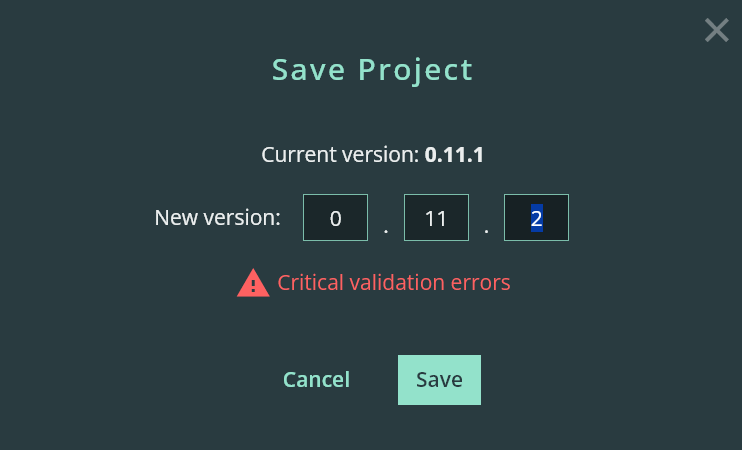
Critical validation issues: You can still save the environment, but it is not possible to activate it. Try to fix the issues which are displayed in the validation panel.